scenarioAnalyzeMonteCarlo#
Motivation#
This script is a basic demonstration of a script that can be used to plot Monte Carlo data with bokeh and datashaders. These tools are very efficient to plot large amounts of simulation data that is likely to occur with Monte Carlo sensitivity analysis studies. For example, running this script will create an HTML interactive view of the simulation data. Instead of seeing a fixed resolution, the user can zoom into the data dynamically to see more detail. This process recreates a newly render view of the simulation data.
The following two plots illustrate what this particular simulation setup will yield.
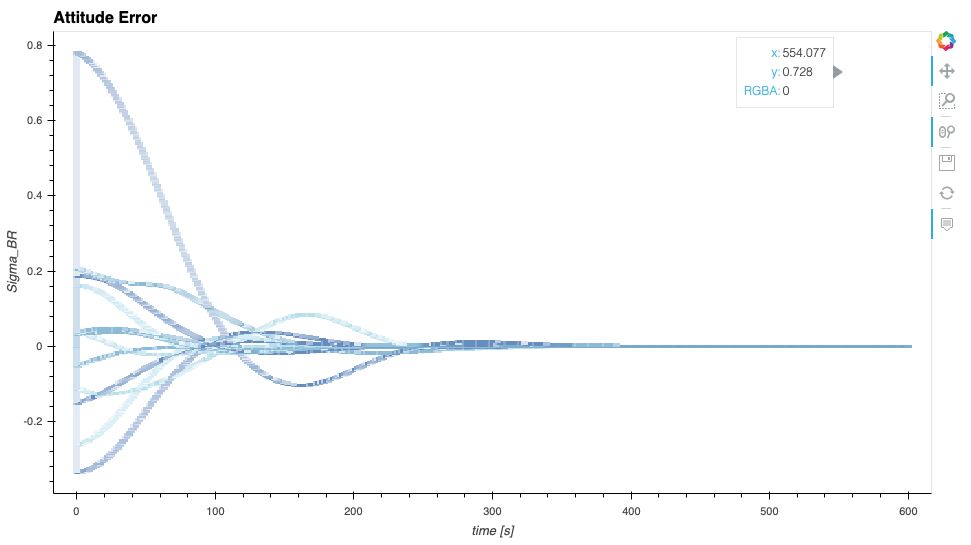
Figure 1: Full view of the attitude error plot data#
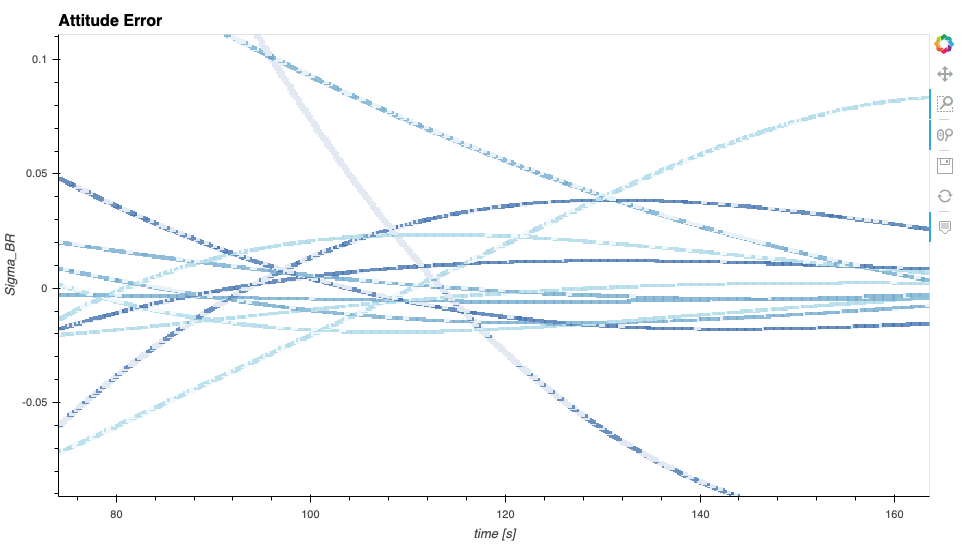
Figure 2: Zoomed in and nearly rendered view of the attitude error data details#
The next plot illustrates the output if you run scenario_AttFeedbackMC.py with more simulation cases,
40 in this plot.
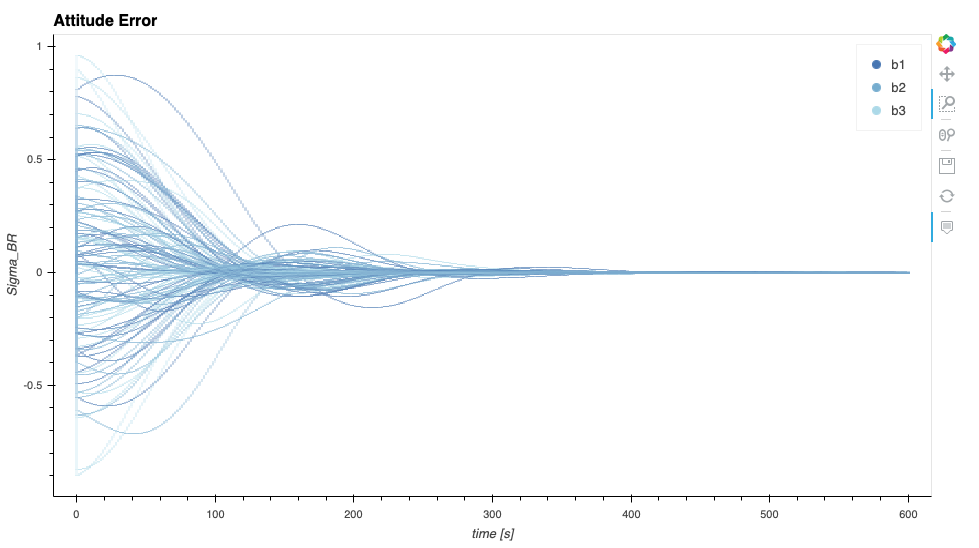
Figure 3: Larger simulation run with 40 simulation cases shown#
Configuring a Python Environment For this Script#
Danger
Running this script is different from running other BSK scripts. There are very particular python package requirements that must be carefully followed. It is recommended the user create a virtual python environment as discussed in the installation setup. This environment might have to be specific to running this script because of these dependency challenges.
The setup steps are as follows:
The datashaders etc. require that this script be run with Python 3.7, not higher
Create dedicated virtual environment and compile Xmera for this environment
Install this particular version of
panelpackage first. It must be done alone as it upgradesbokehto a version that is too new:pip3 install --upgrade panel==1.4.4
Next, install the following particular python package versions:
pip3 install --upgrade bokeh==3.4.2 holoviews==1.16.0 param==2.1.1 hvplot==0.10.0
How to Run the Script#
Important
Read all three steps before advancing.
The next steps outline how to run this script.
This script can only be run once there exists data produced by the
scenario_AttFeedbackMC.pyscript.At the bottom of this script, comment out the name guard and associated
run()statement, and un-comment the followingrun()statement before this script can run. These lines are provided in their commented/uncommented form to ensure that the sphinx documentation generation process does not run this script automatically.This script must be called from command line using:
/$path2bin/panel serve --show /$path2script/scenarioAnalyzeMonteCarlo.py
This will process the data created with scenario_AttFeedbackMC.py and open a browser window showing
Figure 1 above. To end the script you need to press the typical key strokes to interrupt a process as the
bokeh server will keep running until stopped.